ClimateALIGN is Ortec Finance’s independent on-demand Implied Temperature Rise (ITR) analytics platform. Aimed at public and private markets, it is powered by ESG Book's emissions data. The methodology is in line with the TCFD Portfolio Alignment Team’s (PAT) recommendations.
ESG Book’s single source solution enhances corporate sustainability operations, powers better ESG insights, and enables more effective reporting with multiple stakeholders.
Independently sourced and scientifically informed assumptions, input data, and methodology.
Highly granular sector and region coverage—more than 500 sector-region combinations covering the entire investible universe, across all sectors and regions— the ClimateMAPS scenarios integrate and utilize the most advanced macro-econometric model (E3ME) built by Cambridge Econometrics coupled with Ortec Finance’s own stochastic financial model.
Open-source methodology leveraged through Ortec Finance’s contribution to OS-Climate’s Portfolio Alignment tool, in line with standards and best practices set by TCFD’s Portfolio Alignment Team (PAT).
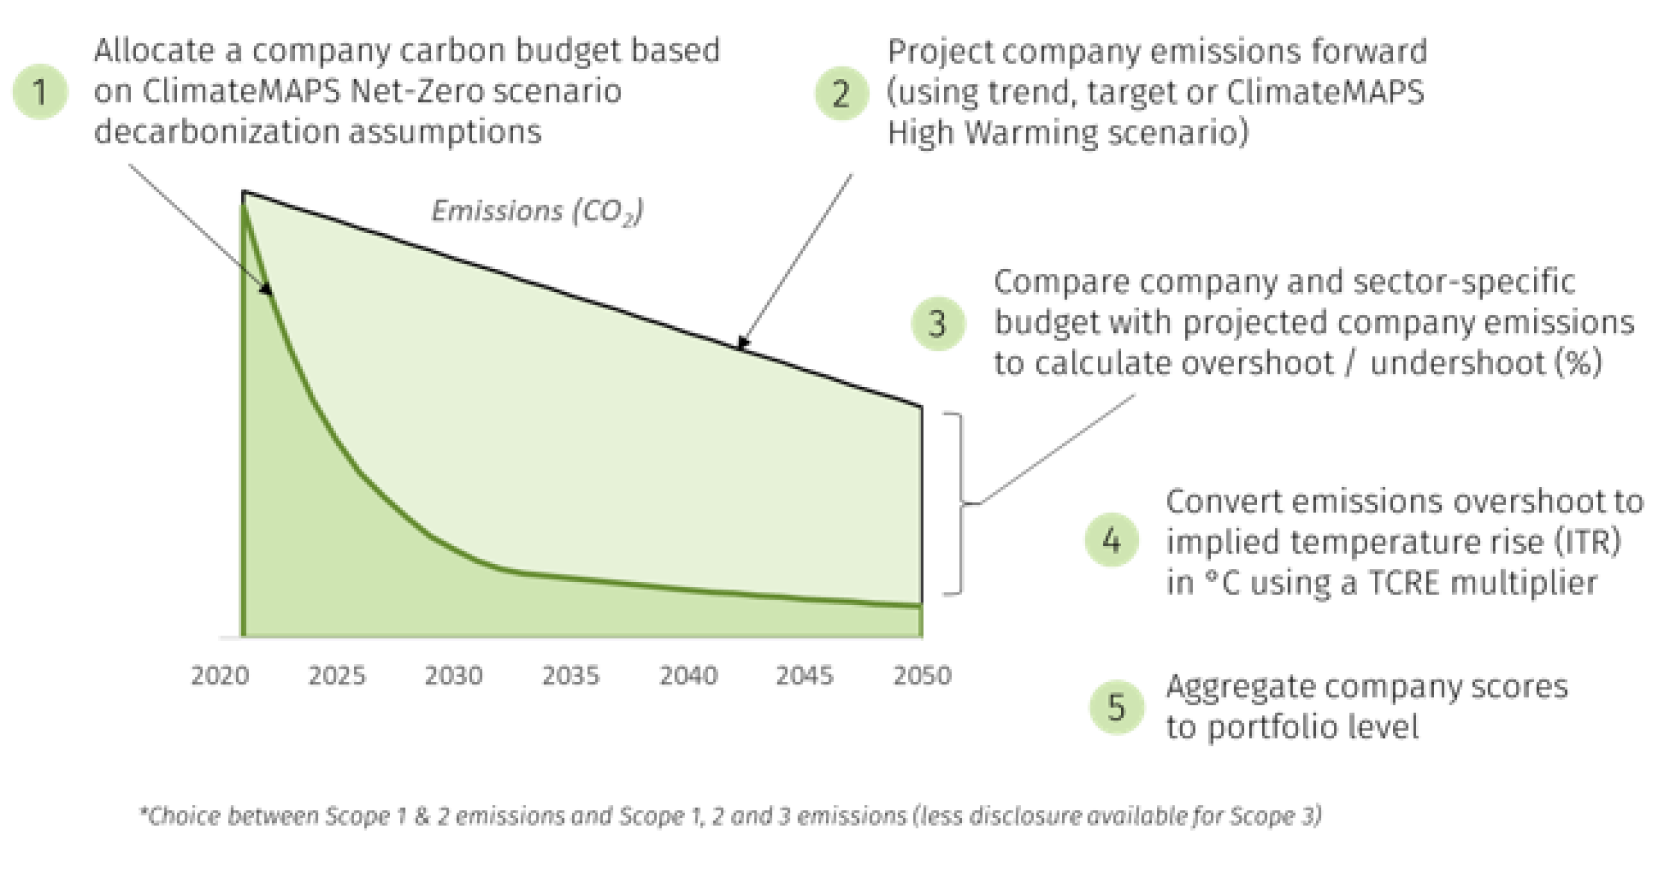
Forward-looking emissions projections based on historical trends from disclosed carbon footprints, SBTi’s verified decarbonization targets, and modeled “business as usual” assumptions.
Disclosure feature enables ongoing data enhancements and updates, using ESG Book platform to request data from public and private companies.
Granular sector-region proxy scores available for (private) companies, built on ESG Book’s climate data universe and modeled data.
Measure, manage and monitor your portfolio’s degree of alignment to net-zero by 2050.
Understand your own company’s alignment to net-zero by 2050 (1.5°C)
Asses how many of your holdings have disclosed relevant data
Engage with portfolio companies by requesting directly on platform to calculate scores using actual, reported data instead of proxies
| Type | Information |
|---|---|
| Update Frequency | Monthly |
| Data Sources | ESG Book and Cambridge Econometrics E3ME Model |
| Methodology Sources | Open-Source Climate (OS-Climate) and Ortec Finance |
| Geographic Coverage | Global |
| Time Period Coverage | 2025, 2030, 2050 |
| Raw / Scraped Data | ESG Book’s Emissions and Financial Data |
| Number of Companies Covered |
Full universe coverage:
* Company coverage will grow as a function of improved public corporate reporting and / or disclosure on ESG Book dashboard.
**Subject to clients sharing sector / region information to facilitate mapping to default proxies |
ClimateALIGN uses the Net-Zero and High Warming
scenarios from ClimateMAPS for its analyses.
The ClimateMAPS scenarios are developed in-house and used as a default
starting point. However, standard reference scenarios and other customized
scenarios can be onboarded for alignment analyses on a bespoke basis
—
please get in touch, we would be happy to explore possibilities.
ClimateALIGN uses company-specific historic (reported) Scope 1-3 emissions data and financial data to calculate ITR outputs. Specifically:
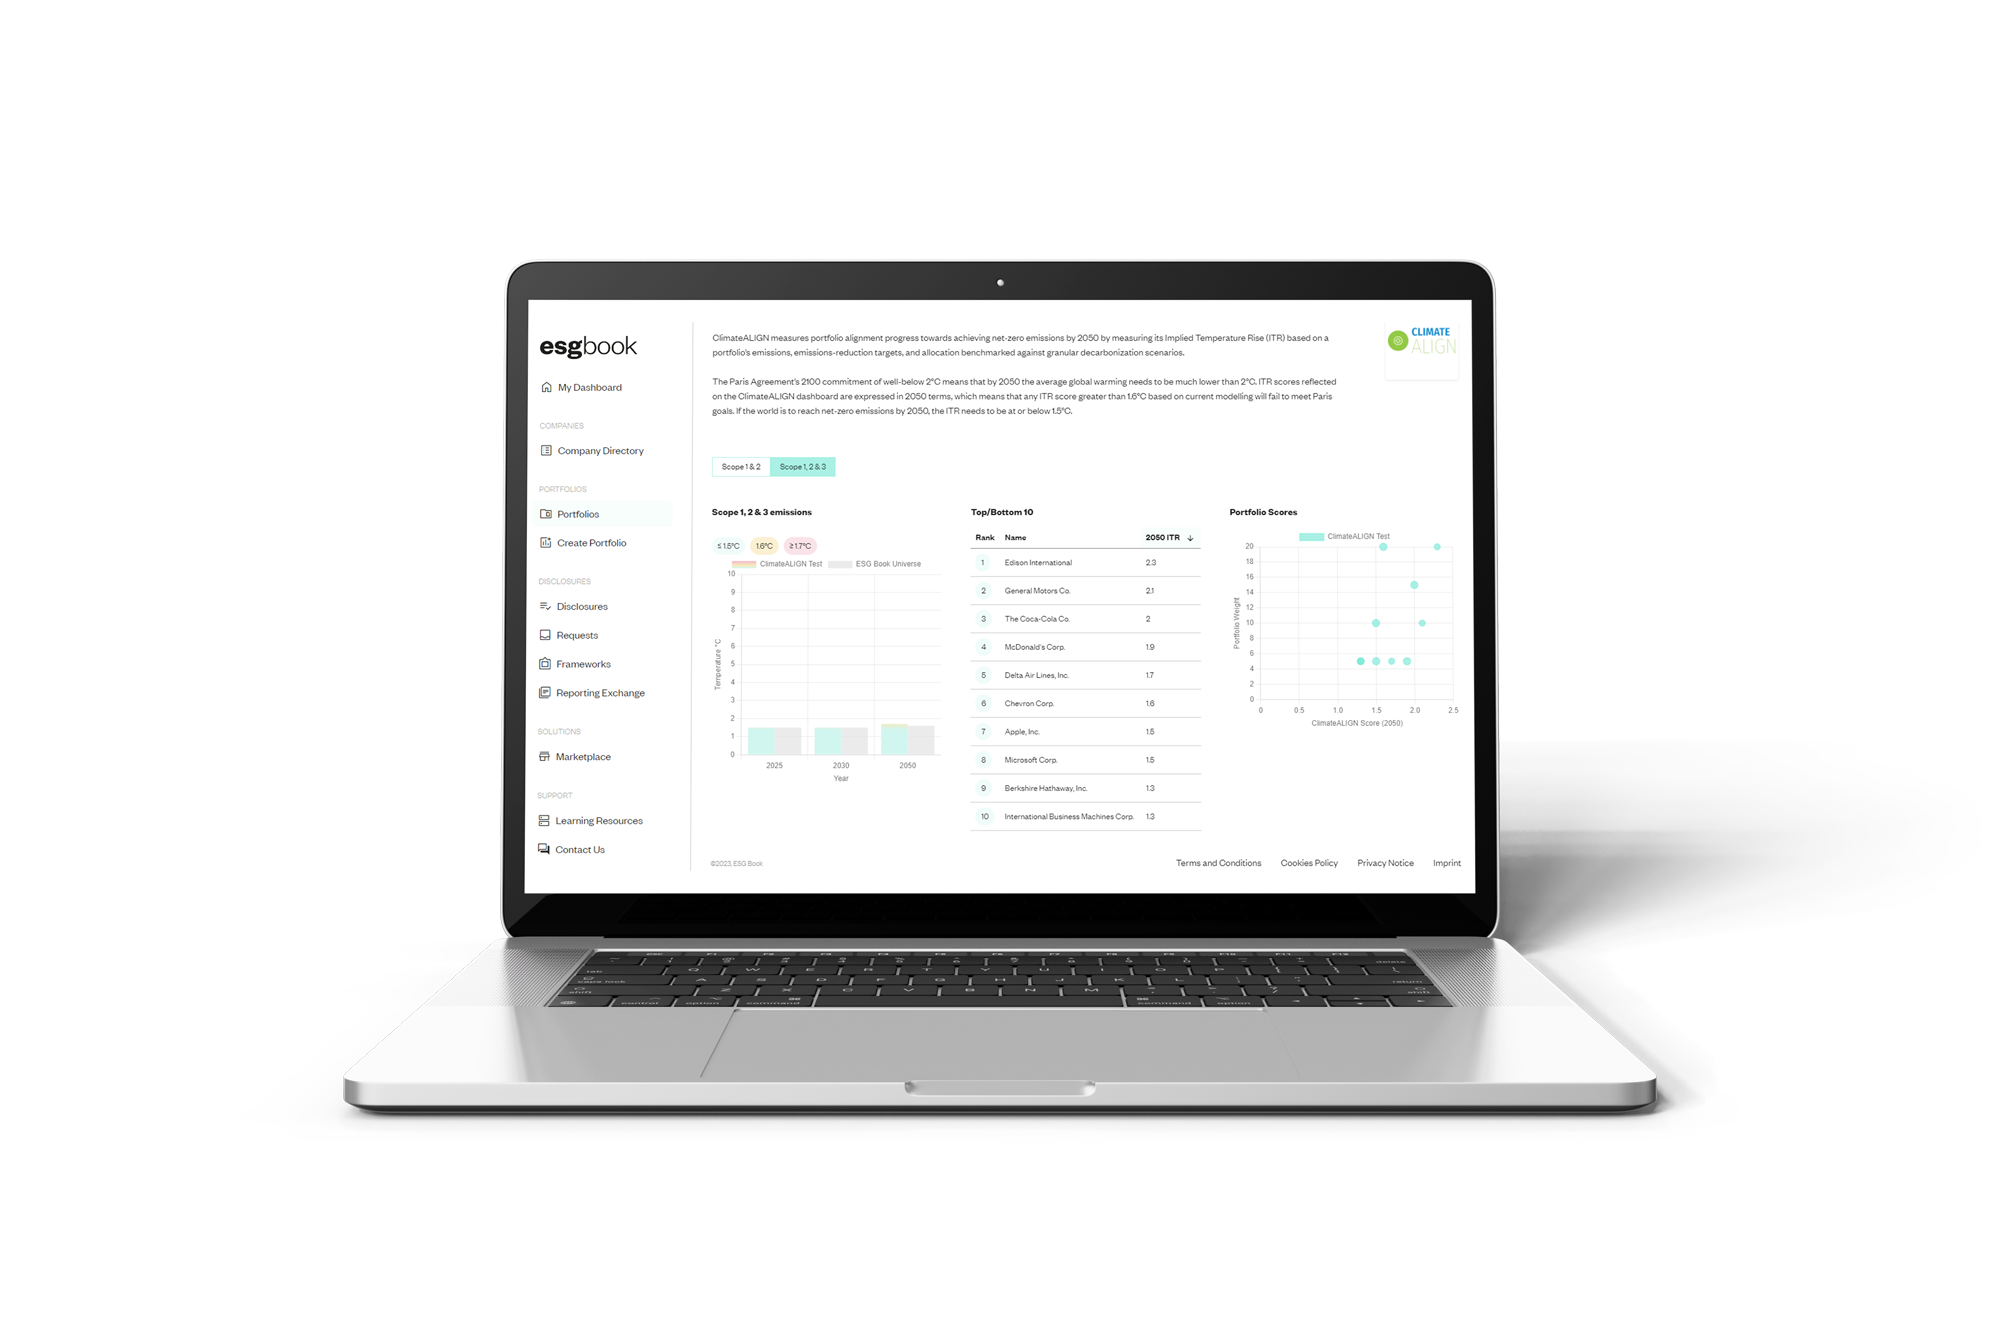
The Paris Agreement’s 2100 commitment of well-below 2°C means that by 2050 the average global warming needs to be much lower than 2°C. ITR scores reflected on the ClimateALIGN dashboard are expressed in 2050 terms, which means that any ITR score greater than 1.6°C based on current modelling will fail to meet Paris goals. If the world is to reach net-zero emissions by 2050, the ITR needs to be at or below 1.5°C.

The Paris Agreement’s 2100 commitment of well-below 2°C means that by 2050 the average global warming needs to be much lower than 2°C. ITR scores reflected on the ClimateALIGN dashboard are expressed in 2050 terms, which means that any ITR score greater than 1.6°C based on current modelling will fail to meet Paris goals. If the world is to reach net-zero emissions by 2050, the ITR needs to be at or below 1.5°C.

*Charts are not to scale but are relative to the data distribution across sectors/geographies.

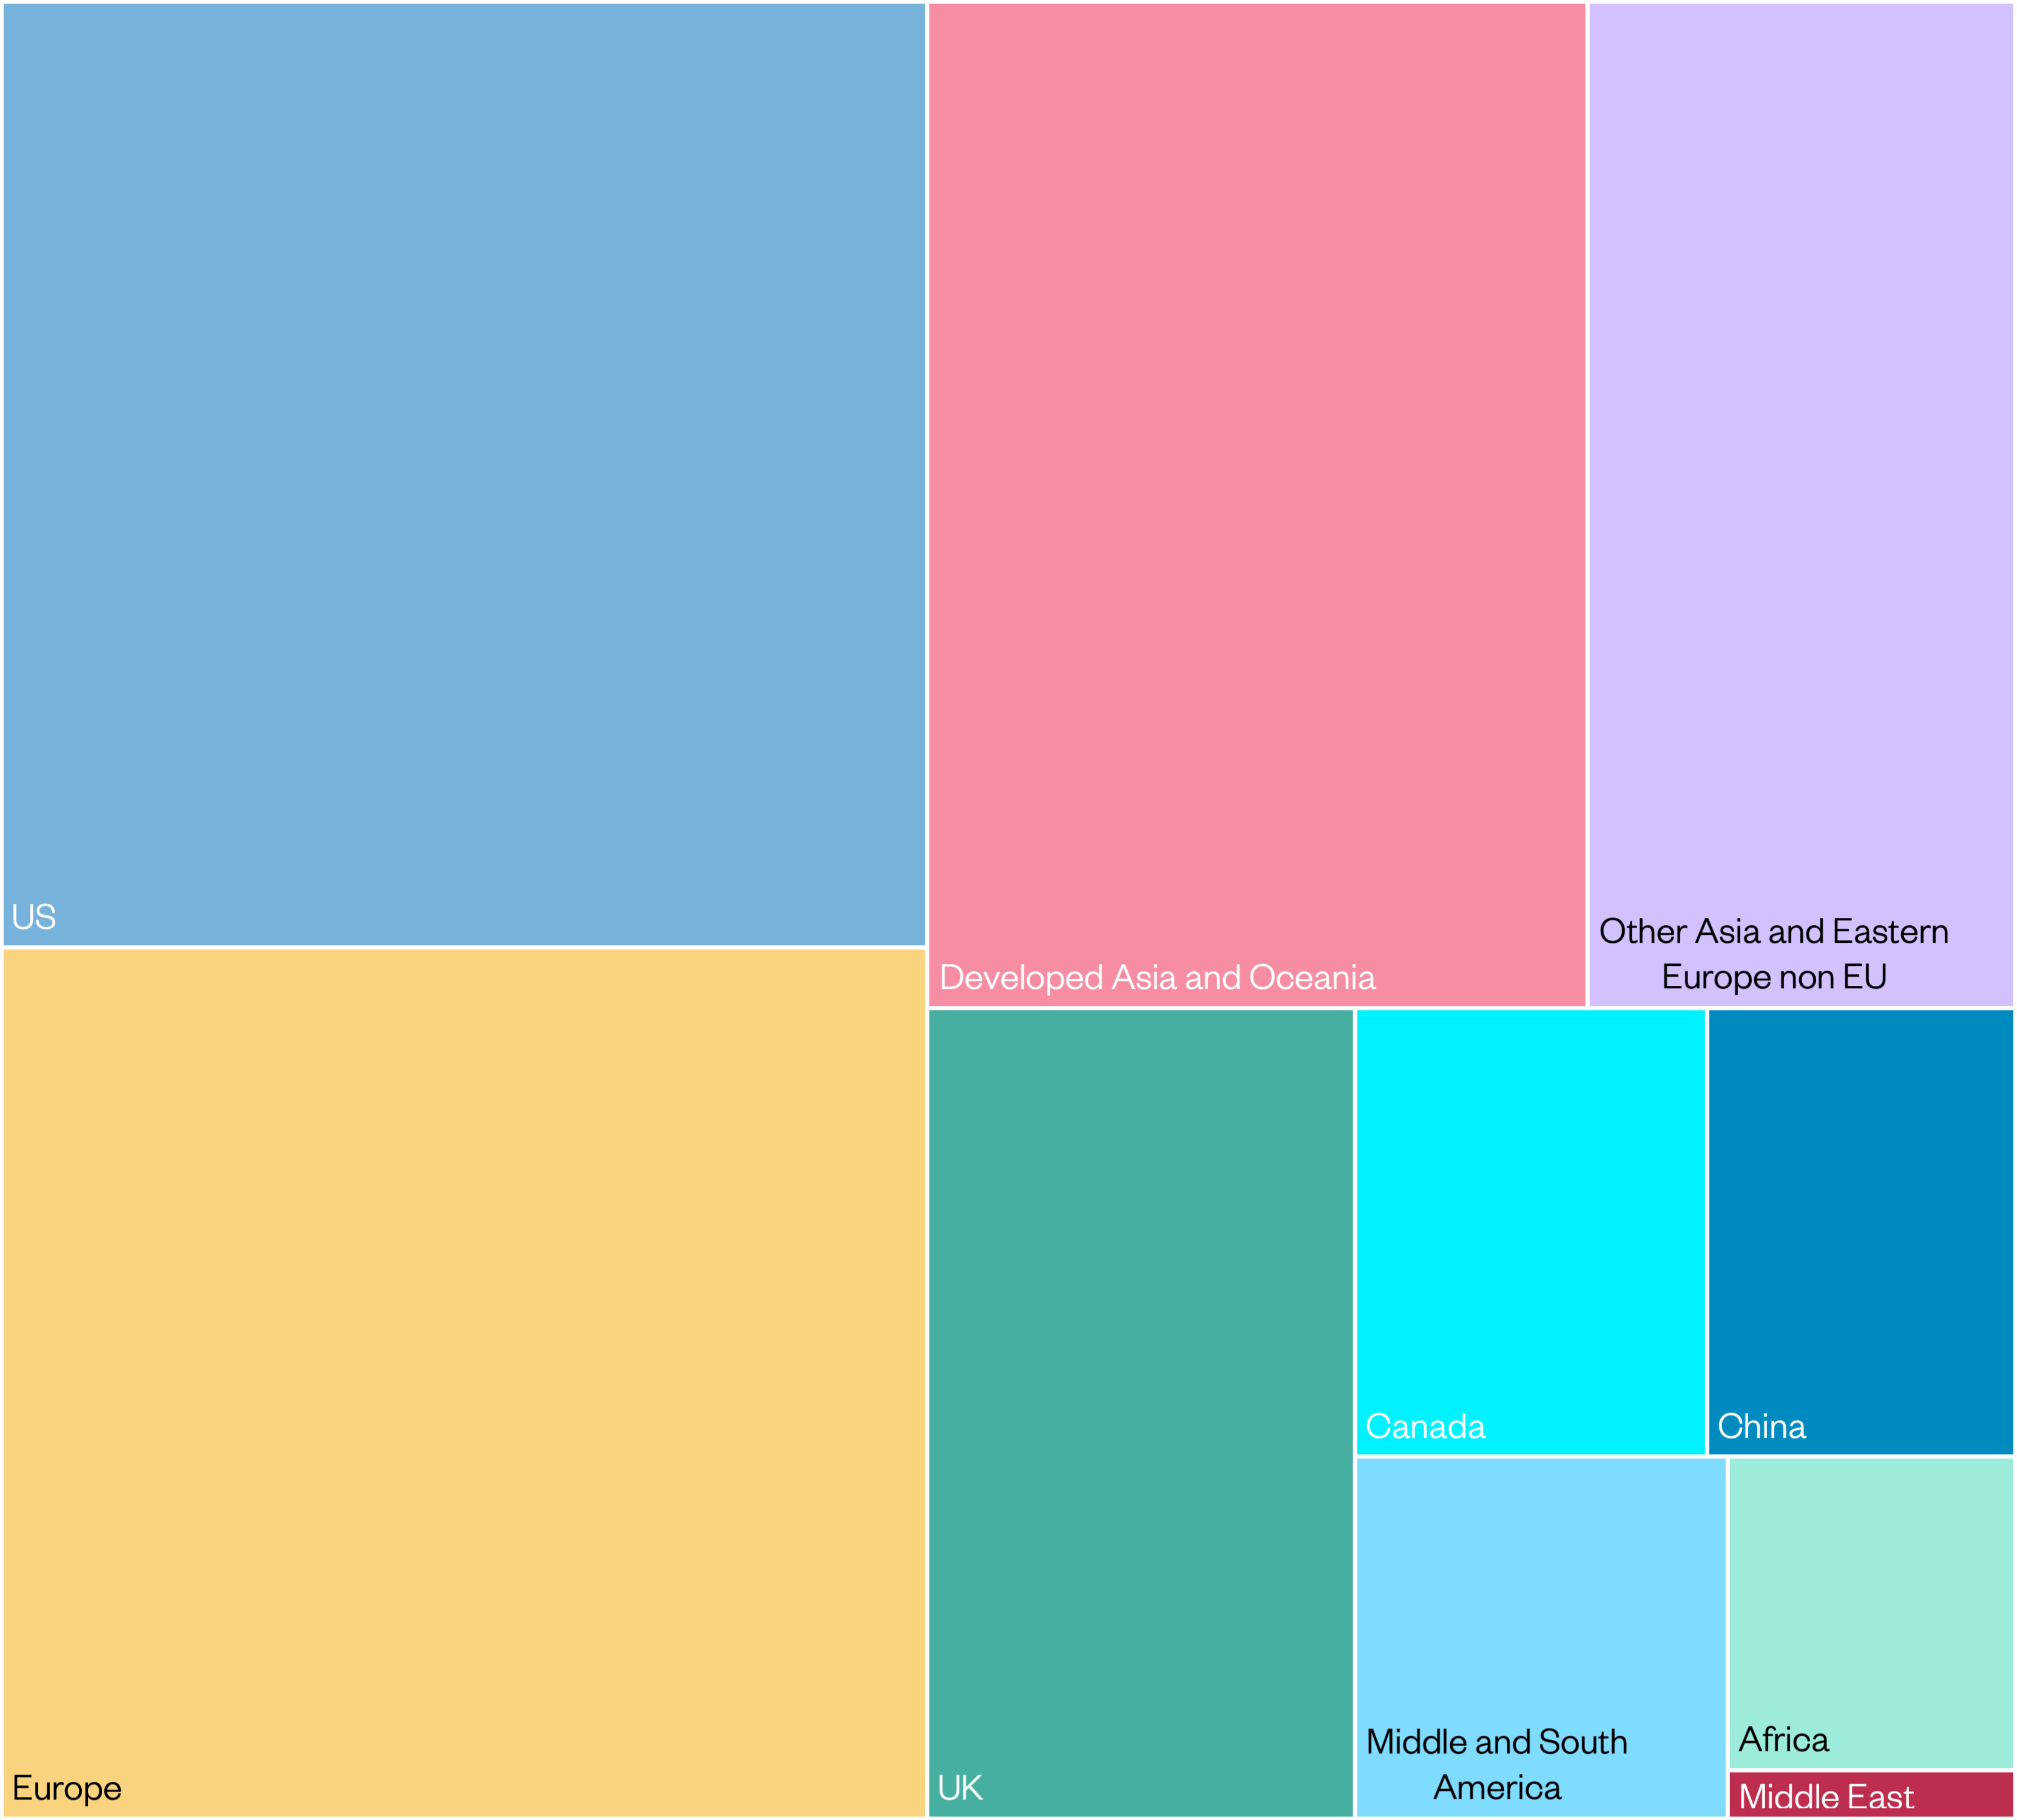
*Charts are not to scale but are relative to the data distribution across sectors/geographies.

Access ClimateALIGN directly on the ESG Book platform or reach out to our team for support.
REQUEST INFORMATIONContact us to learn more about ESG Book’s solutions