Mind the Garbon Gap

“There are as many frameworks as there are disclosures” is a common phrase at ESG Book. It’s not without reason; the number of climate-related regulations and frameworks that companies and investors are expected to adhere to seems to grow by the day. Greenhouse gas (GHG) emissions data is essential for financial market participants to understand corporate alignment to various climate pathways, stress-test climate scenarios to identify transition risks and opportunities, and to engage with and hold companies accountable on their progress to meet their net zero targets.
However, actual disclosure of corporate emissions, particularly those in line with the Greenhouse Gas Protocol (yet another framework, although one of the few that has seen global adoption) remains patchy at best. Less than 4,000 of the world’s leading companies currently report their emissions in line with the GHG Protocol, and that’s just for scope 1 and 2 emissions.
There is an additional challenge associated with the higher levels of disclosure of scope 1 and 2 emissions versus scope 3. When we think about carbon intensive industries (for example energy, airlines, or automobiles), the vast majority of emissions coming out of these sectors will largely fall under a company's scope 3 - i.e., the products and services it sells (downstream emissions), and its supply chain (upstream emissions).
"Less than 4,000 of the world’s leading companies currently report their emissions in line with the GHG Protocol, and that’s just for scope 1 and 2 emissions."
Without scope 3 emissions data, it is easy to jump to unhelpful conclusions. For instance, a solar energy company might have higher carbon intensity in its scope 1 and 2 emissions than a multinational fossil fuel energy company that has created economies of scale and efficiency. But if 90% of emissions in the energy sector come from scope 3 and are not taken into consideration, the likelihood of arriving at incorrect conclusions increases dramatically.
More and more investors are today announcing their aims to reduce portfolio emissions to net-zero, and are paying ever greater attention to corporate emissions data. ESG Book is designed so that companies can more efficiently disclose their scope 1, 2 and 3 emissions in a timely manner, and to enable investors to scrutinise climate data more effectively. But until we reach a time when markets have substantial coverage across sectors, there will be a significant data gap in disclosed emissions coverage, and subsequently a gap in investors’ understanding of their financed emissions exposure.
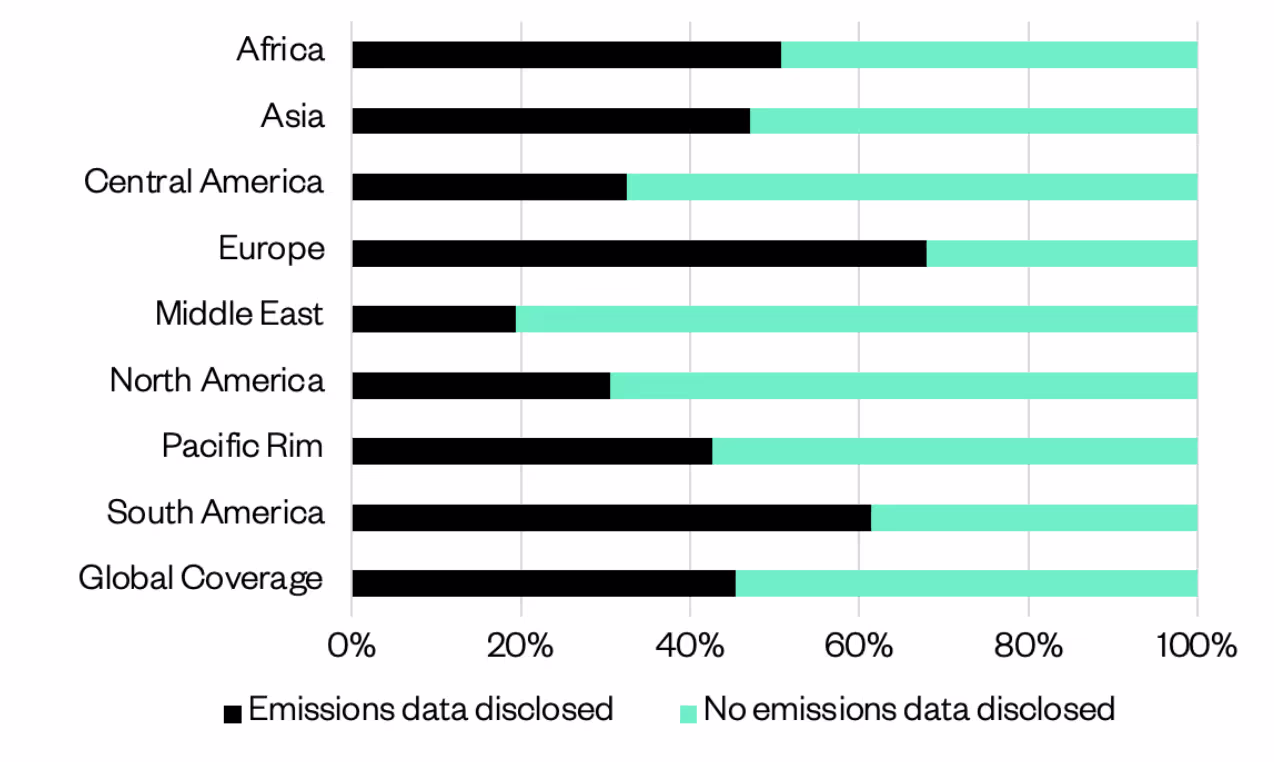
Figure 1. Regional breakdown of the disclosed emissions of 6,200+ companies that ESG Book tracks the climate data of.
In response, ESG Book has developed the Emissions Estimation Model through a best-in-class machine learning approach to provide investors, together with other financial institutions, with greater transparency around the emissions of tens of thousands of companies worldwide.
Covering over 37,000 corporations globally, the Emissions Estimation Model estimates scope 1, scope 2 and scope 3 emissions for each company using independent, industry-leading models which incorporate the latest research on emissions estimation.
Comprised of over 800 sub-models, each developing relationships between available company-level data and emissions for a given industry, geography and emissions scope, ESG Book’s model uses 15 of the most relevant and commonly-disclosed predictors of emissions to better constrain the accuracy of the estimations.
The Emissions Estimation Model’s inputs are carefully selected and processed to ensure that the model learns using accurate input data, while a nine-level regression optimisation process for each company selects the best emission estimate for each scope of emissions.
Additionally, five levels of confidence ratings provide an overview of how accurate an estimation is based on the amount of data available and used in the estimation process.
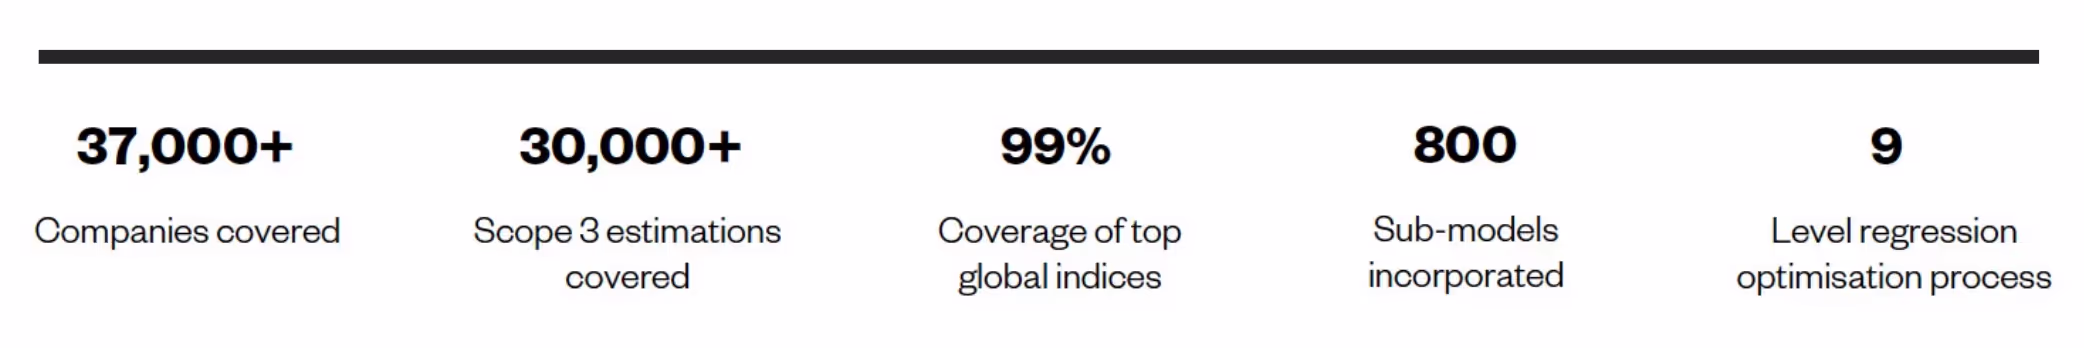
The Emissions Estimation Model in numbers
What companies are covered by the Emissions Estimation Model?
The model’s output is the estimated emissions for approximately 37,000 unique companies globally for scope 1, 2 and, crucially, scope 3 emissions. The vast majority of these are listed corporations, providing a combined disclosed and estimated coverage of over 99% across major indices. The model can also be applied to private companies where sufficient data is available.
With over 30,000 scope 3 (total) estimations, the Emissions Estimation Model is the largest dataset of its kind. Our optimisation approach allows us to build relationships that account for differences in scope 3 reporting per region and industry.
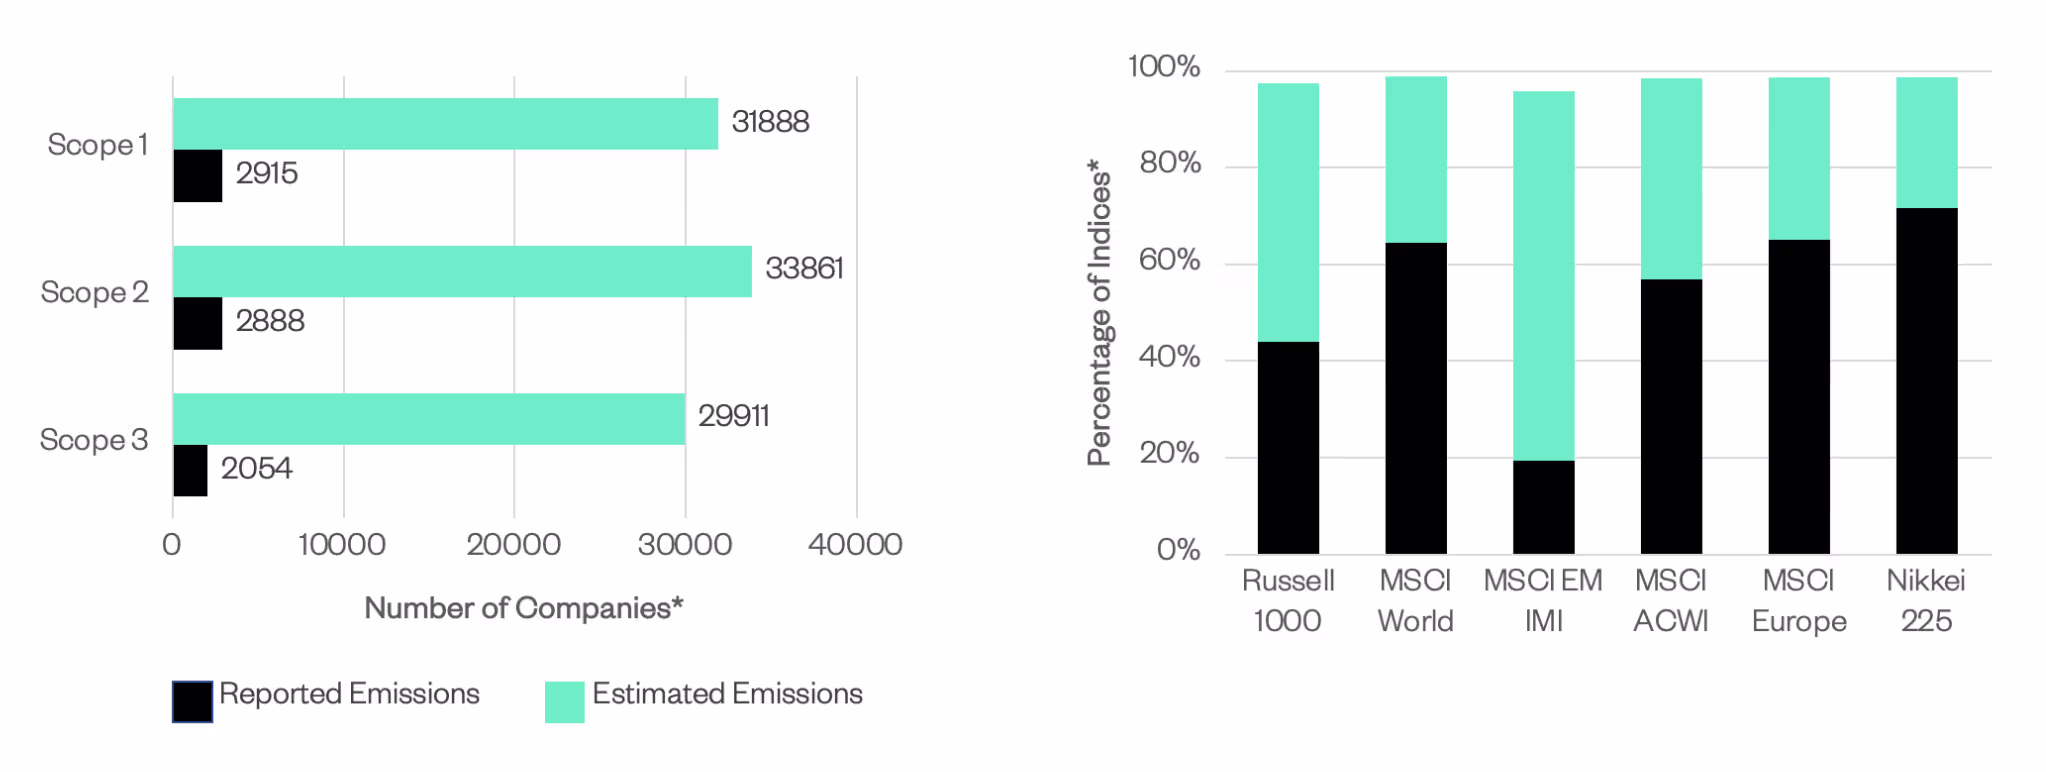
Figure 2. ESG Book’s Emissions Estimation Model coverage across emission scopes and leading global indices.
How is machine learning applied to the model?
Universal to all emissions estimation models is that they create relationships between data points on companies where there is sufficient information (for example on a company’s sector, region, revenue, asset value, or energy consumption) and GHG emissions. The models then use these relationships to predict the emissions for companies where this data is missing.
Relationships between these data points (called ‘predictors’) and emissions might not be a linear one, as is commonly assumed. For example, when a company is scaling-up, it might have more capital to allocate to insulate its buildings, requiring less energy per unit goods produced or services rendered, which would result in a non-linear emission relationship with predictors.
Machine learning models, specifically regression trees, can build complex non-linear relationships, and crucially, can handle missing input data from a company. This differs from other approaches, which fill in blanks either by interpolation or by replacement with zeros.
The approach for ESG Book’s Emissions Estimation Model was trialled against conventional linear multivariable regression and other machine learning models, and has been found to predict emissions more accurately across sectors and geographies for all three emissions scopes. The model’s performance was assessed by comparing the estimated emissions predicted against the actual emissions as reported by the company.
"With over 30,000 scope 3 estimations, the Emissions Estimation Model is the largest dataset of its kind. Our optimisation approach allows us to build relationships that account for differences in scope 3 reporting per region and industry."
What data goes into the model?
Disclosed scope 1 and 2 emissions from approximately 3,000 companies are taken from ESG Book’s Temperature Emissions Raw Data Module. This number is refined to approximately 2,000 for scope 3 emissions. As opposed to ESG Book’s raw data module, which breaks scope 3 emissions into the 15 subcategories defined by the Greenhouse Gas Protocol, in this model we consider scope 3 totals.
Predictors were chosen if they logically indicated the size of a company within an industry and crucially, if they improved model performance. Although there is no mechanistic reason why most predictors relate to emissions, they do provide an indication of the relative size of the company in its industry and location compared to its peers.
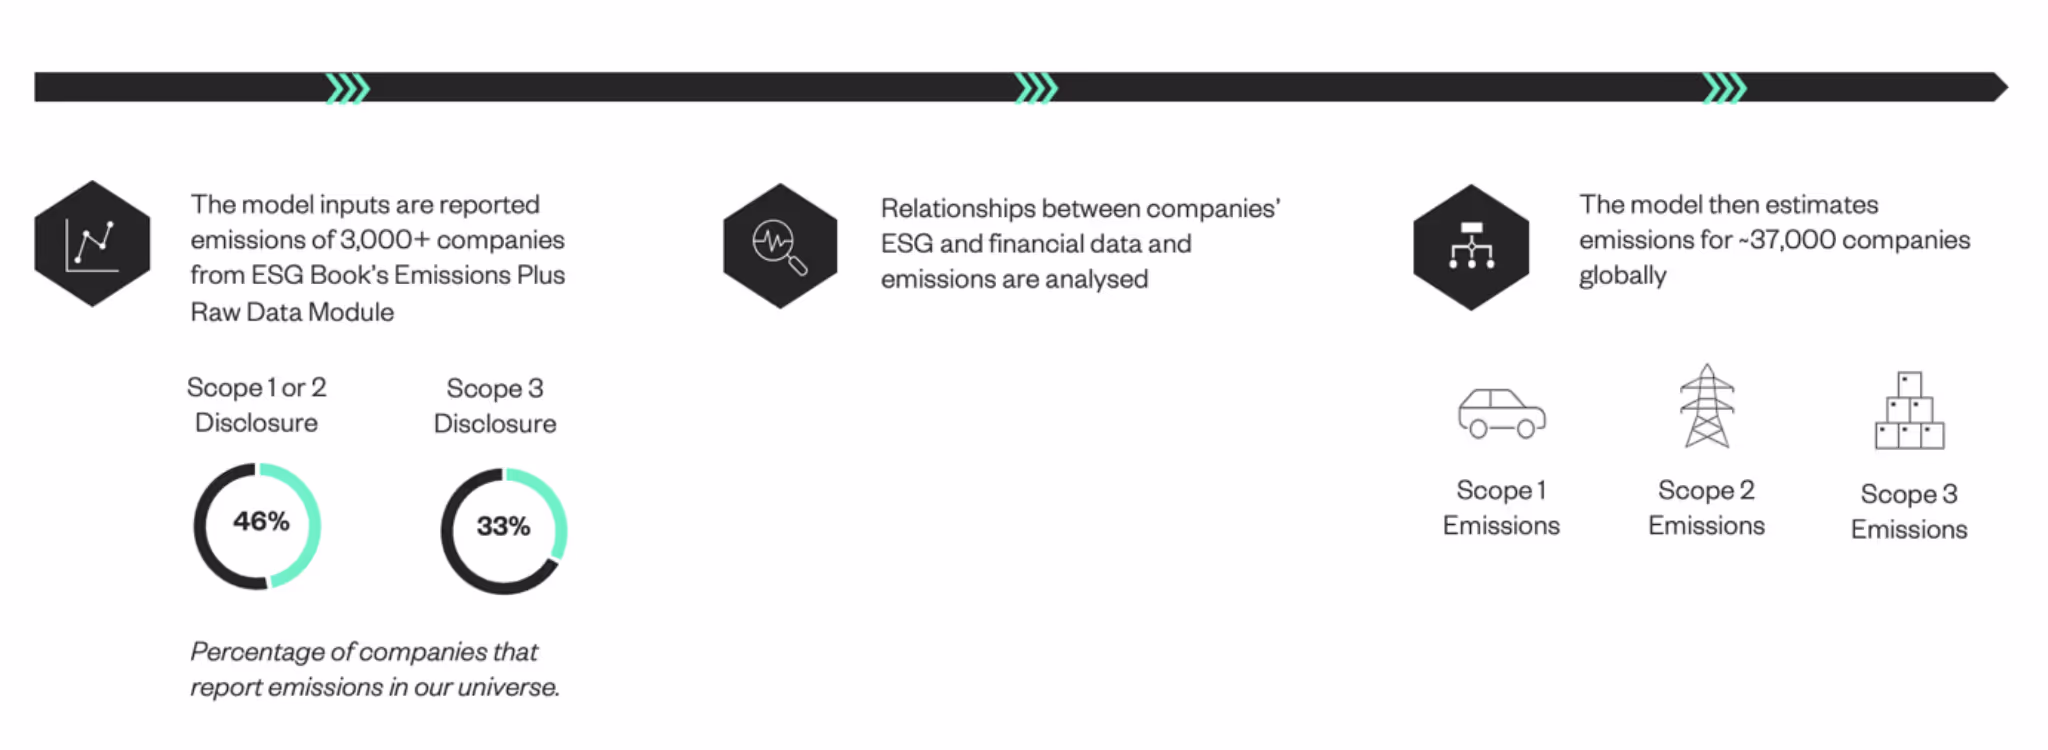
Figure 3. Overview of the Emissions Estimation Model process.
How does the model work?
Relationships between predictors and emissions vary considerably between industries and geography. Although we include a company’s industry, region, and country as input variables in the Emissions Estimation Model, we found that using an optimisation-based approach for industry and geography produced more accurate estimates. In this method, the model optimises for the most highly correlated relationship between estimated and disclosed emissions.
As an example, let’s imagine that we want to estimate the emissions for a French coal production company. The model would first consider energy minerals data (which covers oil, gas and coal production) at a global level. A relationship between inputs data and emissions is then developed, and the predicted results compared to the disclosed emissions data that the model has not previously seen. From this, we are able to determine how strong that relationship is likely to be. The model then examines oil, gas and coal production data at a European level, before finally looking at coal production companies in France at a country level.
Based on the comparison with disclosed emissions, the data relationship that demonstrates the highest correlation and the lowest errors is ultimately chosen by the model.
Transparency
To drive greater transparency around climate data, the Emissions Estimation Model features five levels of confidence ratings to provide an overview of how accurate an estimation is. Confidence ratings are based on how well the model was able to predict the hold out test set for a given industry and geography.
Generally, scope 1 and scope 2 emissions can be estimated to a high degree of confidence, where 47% of scope 1 estimations and 58% of scope 2 estimations fall in the High or Very High confidence categories. Crucially, 70% of scope 1 estimations and 80% of scope 2 estimations can be estimated with a Medium, High or Very High confidence.
Figure 4. The percentage of companies falling into each confidence rating for scope 1, scope 2 and scope 3 estimated emissions.
Unsurprisingly, the confidence ratings of scope 3 estimations are skewed towards the lower confidence categories, where only 10% of scope 3 estimations are in the High or Very High confidence categories. Nonetheless, 49% of scope 3 estimations can be estimated with a Medium, High or Very High confidence. This is due to the current reporting landscape, where scope 3 emissions is often only disclosed for categories that are easier to measure (such as scope 3 Category 6: Business Travel) or disclosed for a part of the company’s operations (such as disclosing emissions for domestic operations only) rather than at a global scale.
Conclusion
ESG Book’s Emissions Estimation Model has yielded carbon emissions estimates for over 37,000 companies globally covering all three scopes. The result is a powerful new tool that enhances the decision-making capabilities of investors and financial institutions in meeting decarbonisation objectives. Part of ESG Book’s comprehensive climate data suite, the Emissions Estimation Model will equip clients with a next generation solution to improve their understanding of financed emissions.